

Table of contents
- Introduction
- Prerequisites
- Steps
- Set up the AWS EC2 instance
- Install Kubectl on your instance
- Install and set up eksctl
- Install Helm on the server
- Install the Kubernetes Metrics Server
- Install AWS EBS CSI addon for your cluster
- Install Prometheus on the existing cluster
- Create Prometheus namespace
- Install Grafana
- Import Grafana Dashboard from Grafana Labs
- Clean up/deprovision
- Conclusion
Introduction
Amazon EKS (Elastic Kubernetes System) is a managed service from AWS that lets you run Kubernetes and Kubernetes-based systems on the cloud with ease. The good thing about AWS EKS is that it conforms with the entire Kubernetes infrastructure so all applications that run on Kubernetes can work seamlessly with Amazon EKS.
In terms of building scalable, highly available cloud-native applications, Kubernetes has kept being the driving force in this area for modern businesses. As businesses keep calling, and moving, the need for proper monitoring and logging systems comes to play. This is where solutions like Prometheus, and Grafana come into play.
In this article, we'd understand why combing the powers of Prometheus and Grafana will unlock the ability to monitor, and properly troubleshoot your Kubernetes infrastructure efficiently.
Prerequisites
AWS EC2 instance with AWS Credentials configured
Working Knowledge of Kubernetes
Working Knowledge of Helm
Steps
Set up the AWS EC2 instance
Select EC2 to create an Elastic Compute instance on the AWS Cloud. While creating, you can select a key pair, or create a new key pair for your instances. Launch the instance once you have created it using the keypair.
Within the instance, you need to install and configure the AWS CLI using the command below.
curl "https://awscli.amazonaws.com/awscli-exe-linux-x86_64.zip" -o "awscliv2.zip"
sudo apt install unzip
unzip awscliv2.zip
sudo ./aws/install
After doing this, we need to configure AWS credentials so that our server can read from our AWS account. We would do this using the following steps
Log into your AWS account
Go to IAM
Create a new user without Programmatic Access
Click on Security Credentials
Download Access Key ID, and Secret Key in a CSV file.
Then open your terminal/command prompt, and configure the AWS credentials using the aws configure command.
Install Kubectl on your instance
Using the following commands, you would need to install kubectl to help the server properly interact with the Kubernetes environment.
curl -LO "https://storage.googleapis.com/kubernetes-release/release/$(curl -s https://storage.googleapis.com/kubernetes-release/release/stable.txt)/bin/linux/amd64/kubectl"
chmod +x ./kubectl
sudo mv ./kubectl /usr/local/bin
kubectl version
Install and set up eksctl
To properly install Kubernetes and all its configurations, we would use the eksctl tool. All we are required to do is to download and extract the latest release of eksctl using the command below.
curl --silent --location "https://github.com/weaveworks/eksctl/releases/latest/download/eksctl_$(uname -s)_amd64.tar.gz" | tar xz -C /tmp
Move the extracted binary to /usr/local/bin, and check whether the installation has been successfully done using
sudo mv /tmp/eksctl /usr/local/bin
eksctl version
Install Helm on the server
The next tools we'd install on the server is Helm. This is a package manager for Kubernetes that helps you to properly manage your applications by making it easy to install, update and delete them. To install them, you download the binary file using the code above, and change the permissions to a "Read, Write and Execute" permission for the owner using the following code.
curl -fsSL -o get_helm.sh https://raw.githubusercontent.com/helm/helm/master/scripts/get-helm-3
chmod 700 get_helm.sh
./get_helm.sh
After installation, you can verify by running helm version
Now, we are done with all the necessary installations.
Now, we will configure the AWS EKS cluster using eksctl. To make this configuration possible, you need the following in this order
Cluster Name: my-cluster (you can give it any name you prefer)
Cluster version: 1.25 and above
Region: us-east-1
node group name: worker-nodes
Number of nodes: 2
Minimum number of nodes: nodes-min 2
Maximum number of nodes: nodes-max 3
Here is how the eksctl command will look like
eksctl create cluster --name my-cluster --version 1.25 --region us-east-1 --nodegroup-name worker-nodes --node-type t2.large --nodes 2 --nodes-min 2 --nodes-max 3
Please note that it would take up to 20 minutes for the installation to be completed.
After the installation, update the kubeconfig file on your local machine using the following command.
aws eks update-kubeconfig --name my-cluster
Install the Kubernetes Metrics Server
We need to install the Kubernetes Metrics Server on the Kubernetes cluster so that Prometheus can collect the performance metrics of the cluster.
Deploy the metrics server, and ensure that it is running using the following command below.
kubectl apply -f https://github.com/kubernetes-sigs/metrics-server/releases/latest/download/components.yaml
kubectl get deployment metrics-server -n kube-system
Install AWS EBS CSI addon for your cluster
The main purpose of setting up this EBS CSI addon is that is helps the clusters to manage the lifecycle of the volumes, especially when the application requires a persistent volume.
- Create an IAM OIDC provider for your cluster. It’s required in order to use AWS IAM roles for service accounts.
oidc_id=$(aws eks describe-cluster --name my-cluster --query "cluster.identity.oidc.issuer" --output text | cut -d '/' -f 5)
aws iam list-open-id-connect-providers | grep $oidc_id | cut -d "/" -f4
eksctl utils associate-iam-oidc-provider --cluster my-cluster --approve
Wherever you see my-cluster, replace it with the name of the cluster provided, or that you set. EKS should tell you the name it gave your cluster if you did not provide one.
Use eksctl to add this IAM role for the cluster.
eksctl create iamserviceaccount \
--name ebs-csi-controller-sa \
--namespace kube-system \
--cluster my-cluster \
--attach-policy-arn arn:aws:iam::aws:policy/service-role/AmazonEBSCSIDriverPolicy \
--approve \
--role-only \
--role-name AmazonEKS_EBS_CSI_DriverRole
Where you see my-cluster, replace it with the name of your cluster provided. This command will create a role using the policy of the EBS CSI Driver that is needed.
Then add the EBS CSI to EKS
eksctl create addon --name aws-ebs-csi-driver --cluster my-cluster --service-account-role-arn arn:aws:iam::111122223333:role/AmazonEKS_EBS_CSI_DriverRole --force
Make sure to change the name of your cluster where you see my-cluster.
In the above command, make sure you change 111122223333 to YOUR account ID. You can find your account ID by going to the AWS console and going to the top right of your screen where your login is with the down arrow. It should display the Account ID allowing you to copy it.
Install Prometheus on the existing cluster
After you have installed the Metric Server, next we'd install Prometheus using the Helm utility we installed earlier.
helm repo add prometheus-community https://prometheus-community.github.io/helm-charts
helm repo update
hepo repo list
helm repo update and helm repo list commands are used to update the helm chart repository.
Create Prometheus namespace
To create a namespace, run kubectl create namespace prometheus
After the creation of the namespace, run
 helm install prometheus prometheus-community/prometheus \
    --namespace prometheus \
    --set alertmanager.persistentVolume.storageClass="gp2" \
    --set server.persistentVolume.storageClass="gp2"
Ensure that all the Prometheus pods are running on the Kubernetes cluster. Then
kubectl port-forward deployment/prometheus-server 9090:9090 -n prometheus
Install Grafana
First, we will add the Grafana helm chart repository. Later, Update the helm chart repository.
helm repo add grafana https://grafana.github.io/helm-charts
helm repo update
Now we need to create a Prometheus data source so that Grafana can access the Kubernetes metrics. Create a yaml file prometheus-datasource.yamland save the following data source configuration into it.
datasources:
  datasources.yaml:
    apiVersion: 1
    datasources:
    - name: Prometheus
      type: prometheus
      url: http://prometheus-server.prometheus.svc.cluster.local
      access: proxy
      isDefault: true
Create a namespace grafana
kubectl create namespace grafana
Install Grafana
helm install grafana grafana/grafana \
    --namespace grafana \
    --set persistence.storageClassName="gp2" \
    --set persistence.enabled=true \
    --set adminPassword='EKS!sAWSome' \
    --values prometheus-datasource.yaml \
    --set service.type=LoadBalancer
This command will create the Grafana service with an external load balancer to get the public view.
Verify the Grafana installation by using the following kubectl command -
kubectl get all -n grafana
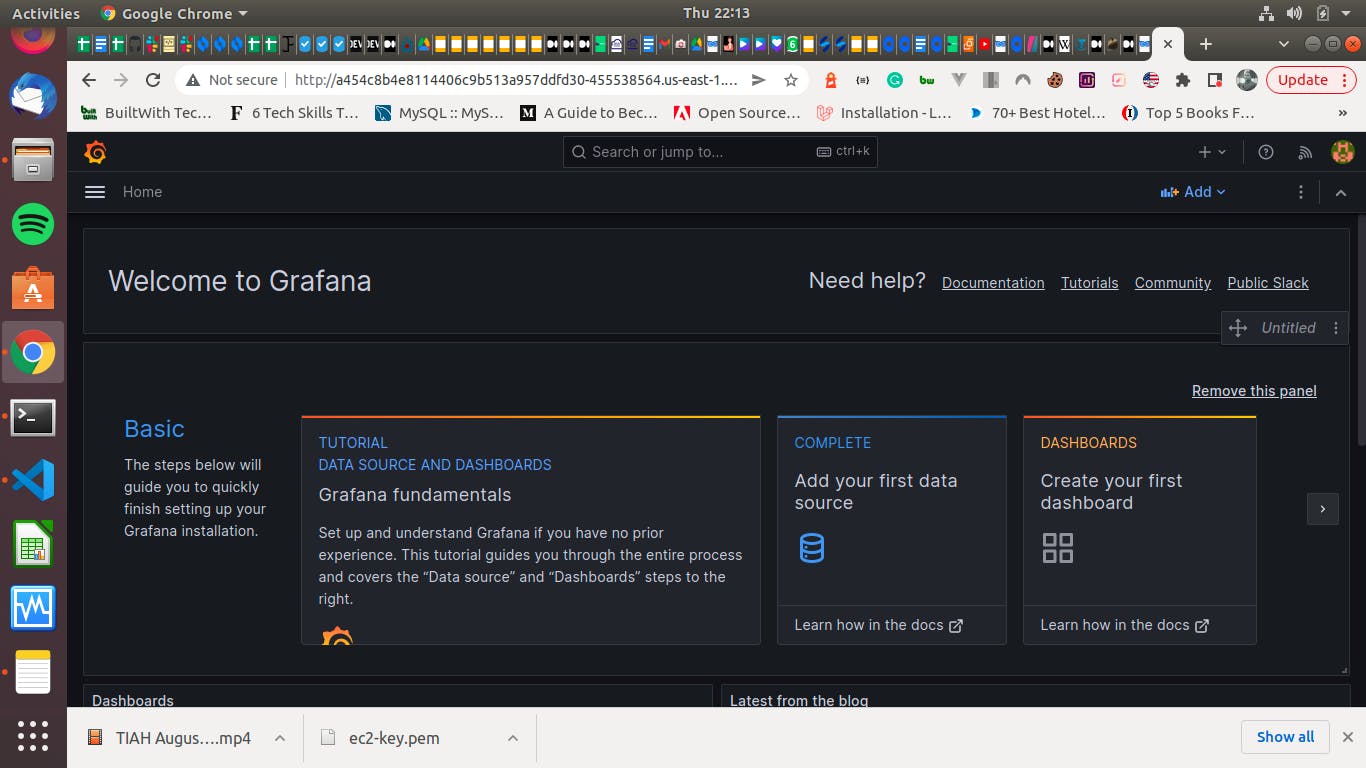
Copy External IP address and open it in the browser -
Password you mentioned as EKS!sAWSome while creating Grafana
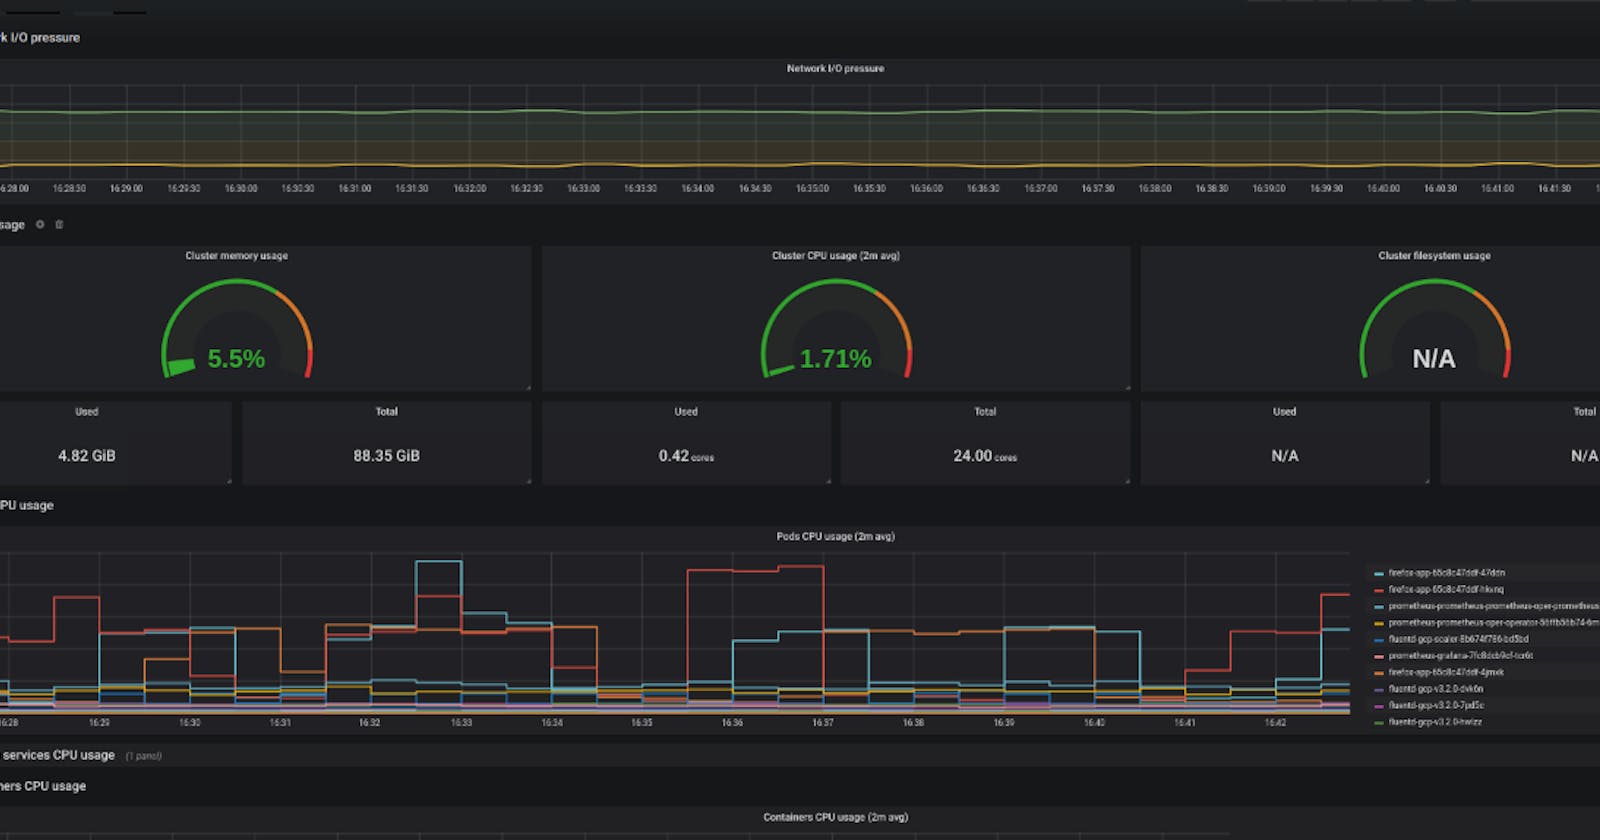
Import Grafana Dashboard from Grafana Labs
Now we have set up everything in terms of Prometheus and Grafana. For the custom Grafana Dashboard, we are going to use the open source grafana dashboard. For this session, I am going to import a dashboard 6417
Clean up/deprovision
Now we will deprovision all our resources. First, let's start with EKS cluster
eksctl delete cluster --name my-cluster
Conclusion
In conclusion, deploying a Simple Monitoring Setup using Prometheus and Grafana on AWS EKS brings immense value to any organization looking to optimize their containerized applications. By harnessing the power of Prometheus to collect and store metrics, and Grafana to visualize and analyze the data, teams gain a comprehensive understanding of their system's health, performance, and resource utilization.